Are you looking to land your dream job in market risk?
"Mastering Market Risk: An Interview Prep Guide" is the ultimate resource for anyone looking to succeed in their market risk interview.

This comprehensive guide covers all the essential topics and questions you can expect to encounter in your interview, including financial markets, risk management, regulation, and more. With tips and strategies from industry experts, practice questions, and insider knowledge, this guide will give you the tools and confidence you need to ace your market risk interview and secure the job of your dreams.
Don't go into your interview unprepared - start mastering market risk today with "Mastering Market Risk: An Interview Prep Guide"!
What is Market Risk?
Market risk, also known as systematic risk, is the risk that is inherent in the market as a whole and affects the value of all assets in the market. It is influenced by factors such as economic conditions, political events, and changes in market sentiment. Market risk can have a significant impact on the performance of a portfolio and cannot be avoided by holding a particular asset or security. To manage market risk, investors can diversify their portfolios, implement risk management strategies, and monitor market conditions.
Market risk refers to any financial risk that arises due to unanticipated changes or fluctuations in the market risk factors.
Any financial risk: Financial risk entails the possibility of financial loss arising from uncertainties in the financial markets. It is inherent in any financial investment and encompasses various components, with "market risk" being a key one.
Unanticipated change or fluctuation: Changes in asset prices can be categorized as either anticipated or unanticipated. Anticipated changes should be factored into product pricing to account for expected fluctuations. For instance, a tomato seller factoring in anticipated waste before pricing tomatoes illustrates the importance of considering foreseeable losses for informed decision-making.
Market risk factors: Market risk factors are variables contributing to changes or fluctuations in the value of financial products. These factors include changes in interest rates, which affect the value of fixed-income securities like bonds. For example, when interest rates rise, bond prices typically fall, making interest rates a market risk factor for bonds.
What are some strategies for managing market risk?
Strategies for managing market risk may include diversification of assets, hedging, using financial instruments such as options or futures, and monitoring and adjusting risk exposure as market conditions or risk factors change.
Diversification: By spreading investments across different asset classes, sectors, or geographical regions, IB can reduce the impact of any one market downturn on its portfolio. Diversification can be achieved through investing in mutual funds, exchange-traded funds (ETFs), or other diversified investment vehicles.
Hedging: Hedging involves taking an offsetting position in a related security or asset to mitigate the risk of losses from an adverse price movement. For example, an IB who owns a stock may hedge their exposure by buying put options.
Options, futures, and other derivatives can be used to manage market risk providing flexibility in managing exposure to specific risk factors such as interest rates, currency fluctuations, or commodity prices.
Monitoring and adjusting risk exposure: IB can monitor market conditions and risk factors on an ongoing basis and adjust its portfolio's risk exposure as needed. This may involve reallocating assets, reducing exposure to specific sectors or securities, or increasing cash reserves to reduce overall risk.
What are the broader risk asset classes for the purpose of market risk capital requirement?
For the purpose of capital requirement, market risk includes equity (EQ) risk, interest rate (IR) risk, foreign exchange/currency (FX) risk, and commodities (COM) risk.
What is the difference between a local volatility model and a stochastic volatility model?
The local volatility model and stochastic volatility model are two widely used approaches in quantitative finance for pricing financial derivatives. The key difference between the two lies in the way they handle volatility.
A local volatility model assumes that the volatility of the underlying asset is a deterministic function of time and the asset price, meaning that the volatility is fixed and does not change with time or the asset's price. This makes local volatility models computationally less complex than stochastic volatility models. However, they are less accurate in modeling the behavior of the underlying asset, particularly in extreme market conditions.
this model would be more appropriate to use in the case of:
European plain vanilla options with no early exercise features.
When market volatility is stable and not subject to large swings.
When pricing a single asset or a portfolio of assets with similar risk characteristics.
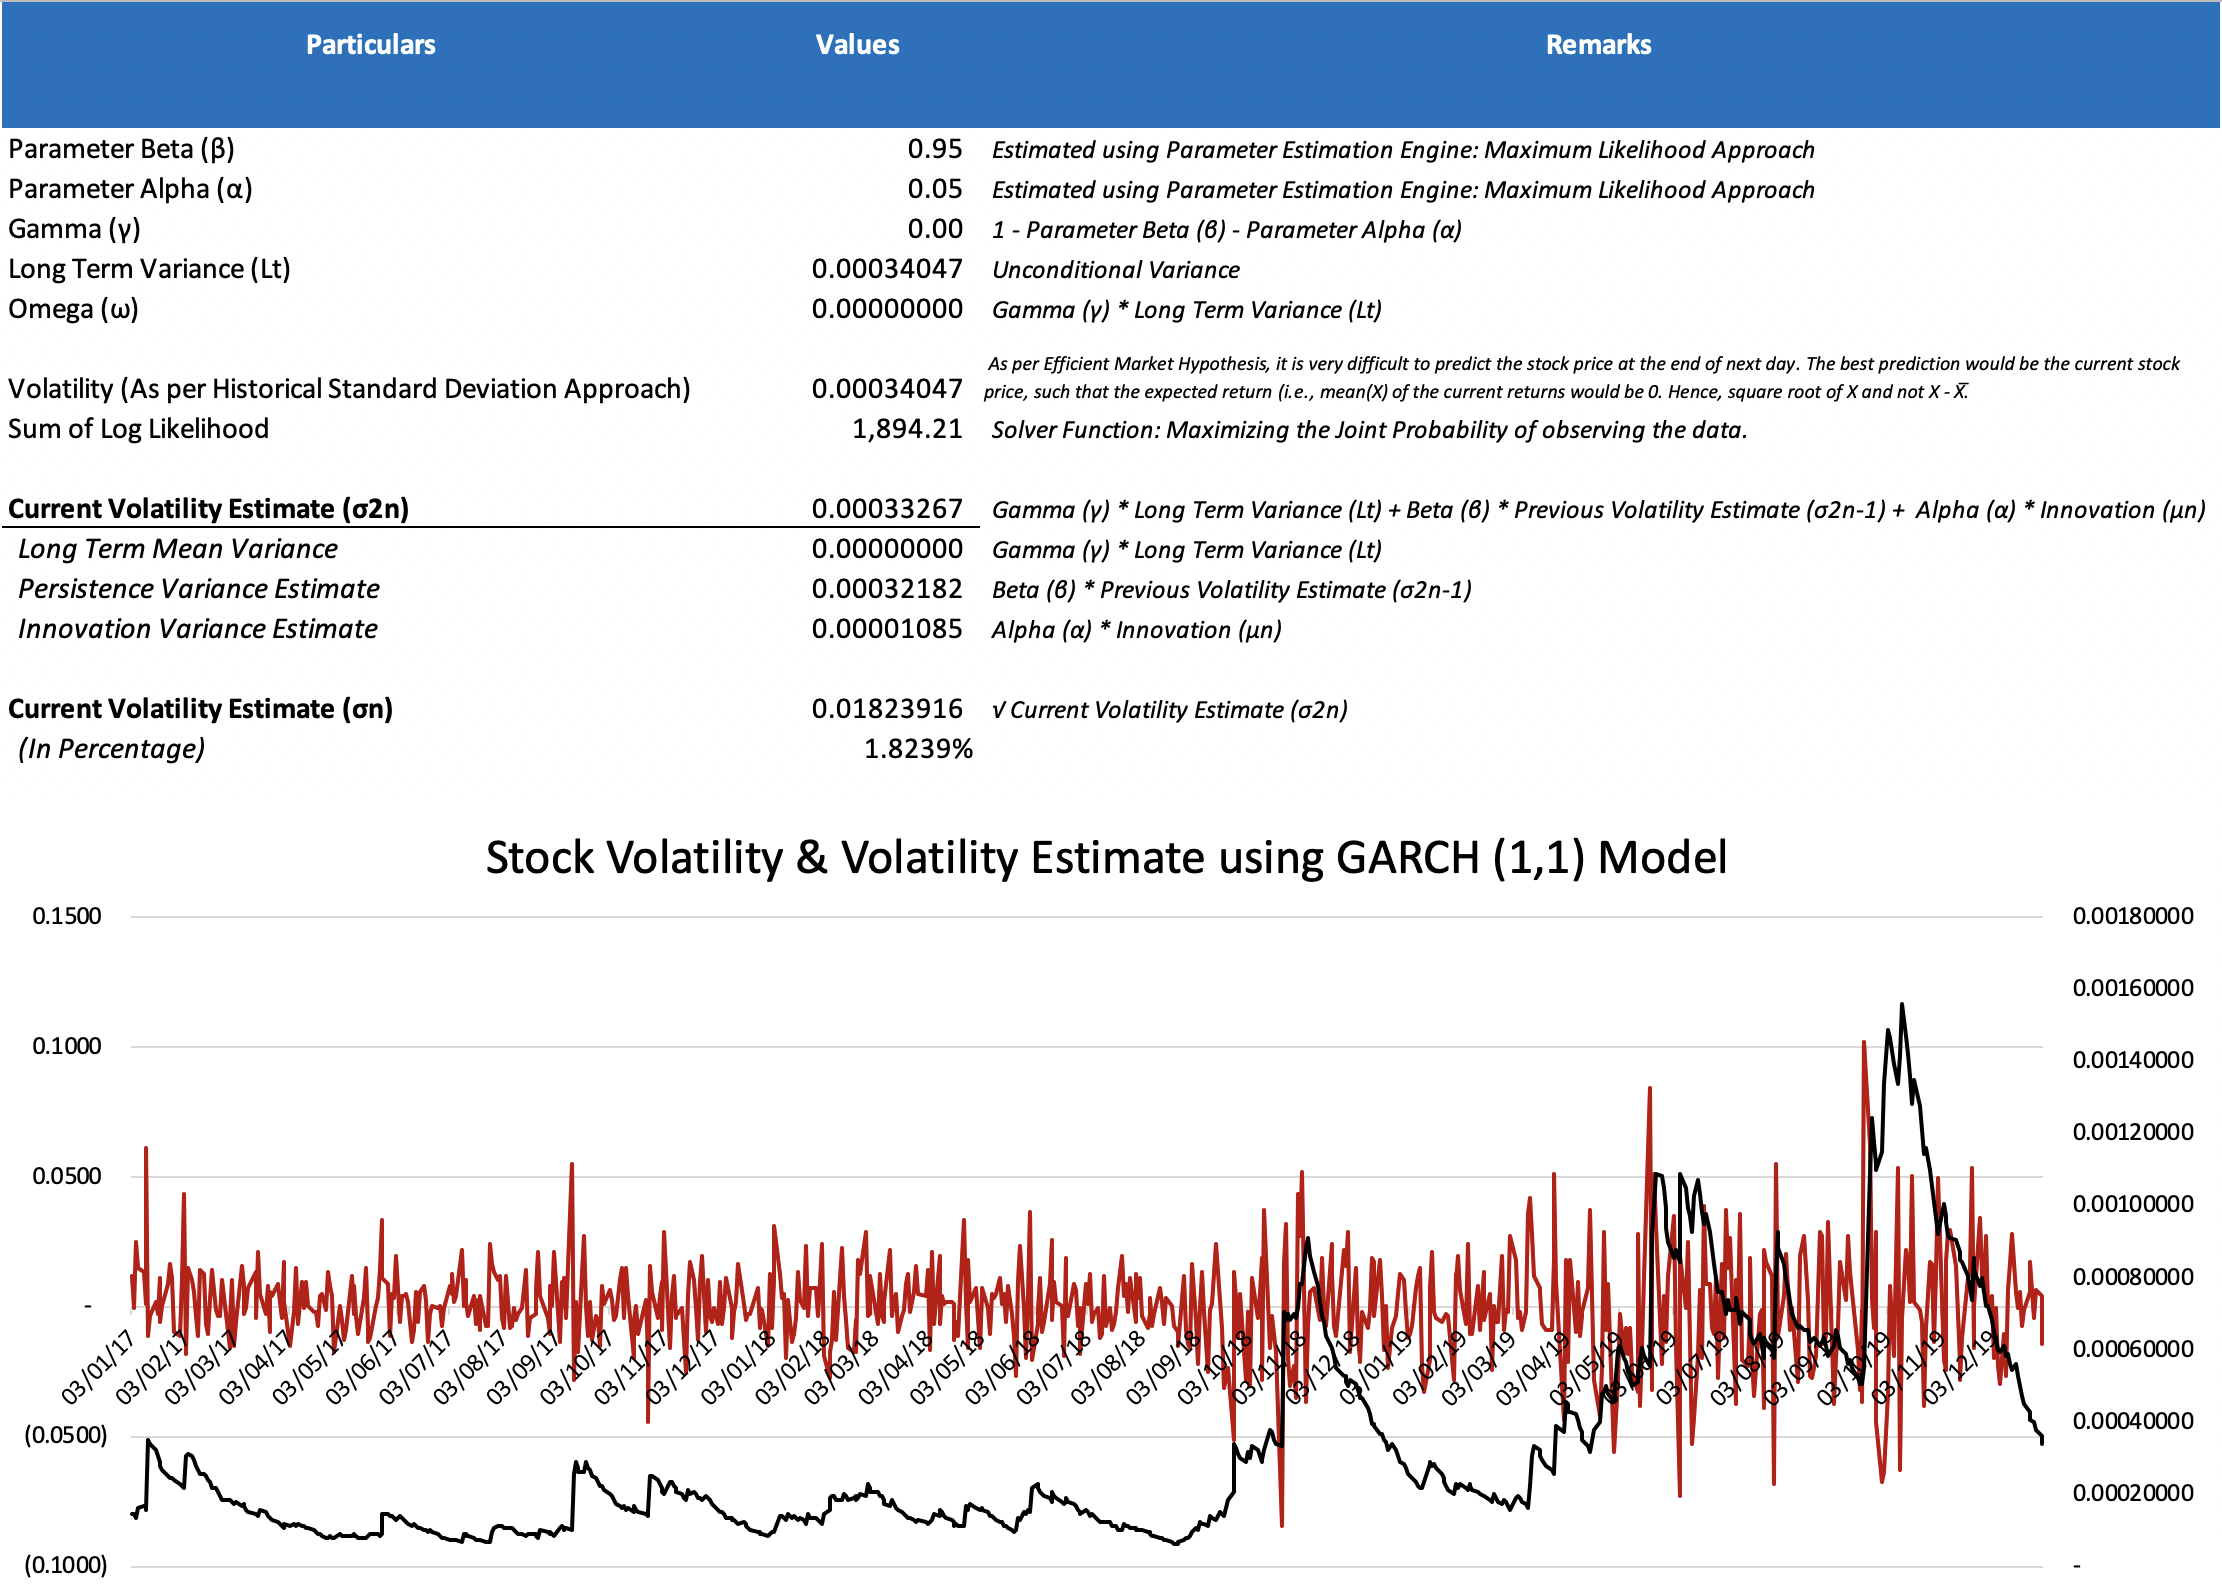

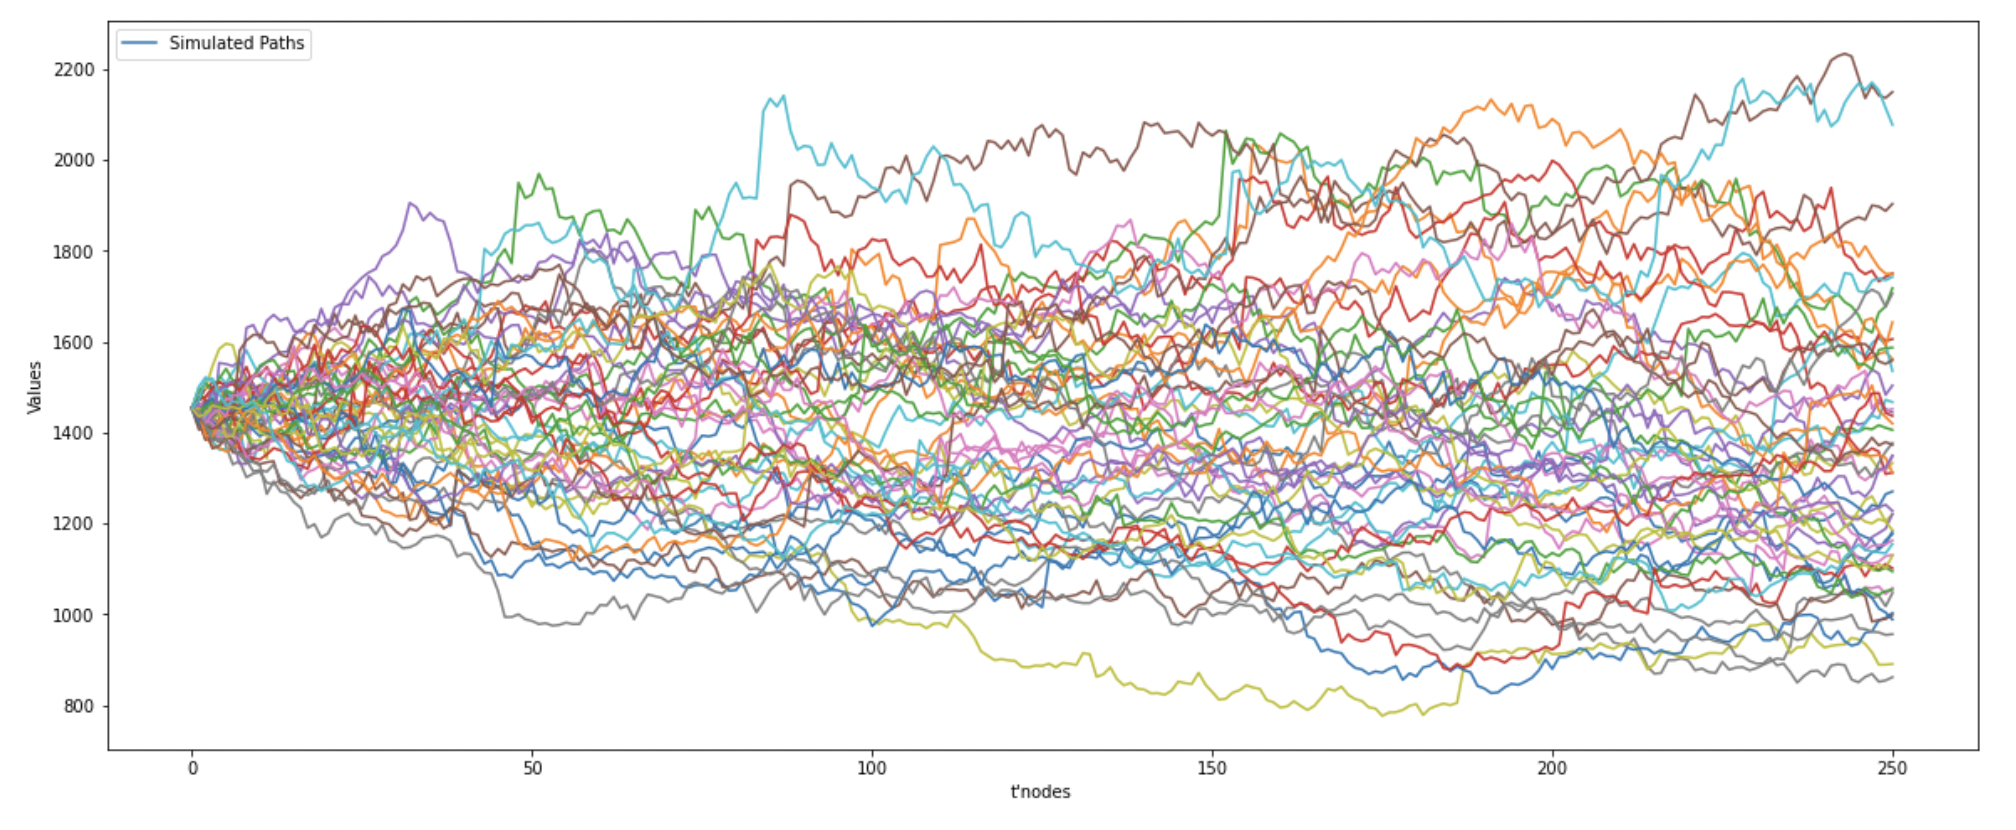
A stochastic volatility model assumes that the volatility of the underlying asset is a random variable that follows a particular stochastic process. Stochastic volatility models are more complex and computationally intensive, but they can better capture the behavior of the underlying asset, particularly in volatile market conditions.
this model would be more appropriate to use in the case of:
American-style options or other options with early exercise features.
When the market volatility is highly volatile and unpredictable.
When modeling the behavior of complex derivatives that depend on multiple underlying assets with different risk characteristics.
What is Value-at-Risk (VaR)?
In a general context, the value-at-risk measure targets to calculate the maximum possible loss that can occur on investment under normal circumstances at a certain confidence level in a given time frame. Suppose, if a portfolio of securities has a 1-Day 99% relative VaR of -2.3430%, it means that there is a 99% probability that the maximum loss on this portfolio could be -2.3430% over a single-day period with a 1% probability of its being exceeded. Therefore, the absolute VaR will be -2.3430% of $5 million = $-0.11715 million
What is absolute VaR vs. relative VaR?
What are the limitations of VaR?
Value-at-Risk though has some valid reasons for its popularity, especially within investment banks and other big financial institutions, but it comes with a few limitations.
When it comes to determining the risk of a portfolio, a risk measure is expected to incorporate the correlation between each pair of assets. However, with the increased number of assets and diversity of positions in the portfolio, it becomes very difficult to calculate and incorporate the correlations precisely for risk reduction.
Speaking about the first limitation, this risk measure becomes non-additive. "the value-at-risk of asset A plus the value-at-risk of asset B is not equal to the value-at-risk of a portfolio containing asset A and B due to the correlation that exists between them."
As mentioned, one has to choose between the methods that can be used to calculate the value-at-risk number. However, different methods eventually lead to different results. It becomes difficult to make the right choice between these methods: The Historical Simulation Method, Parametric Method, and Monte-Carlo Simulation Method.
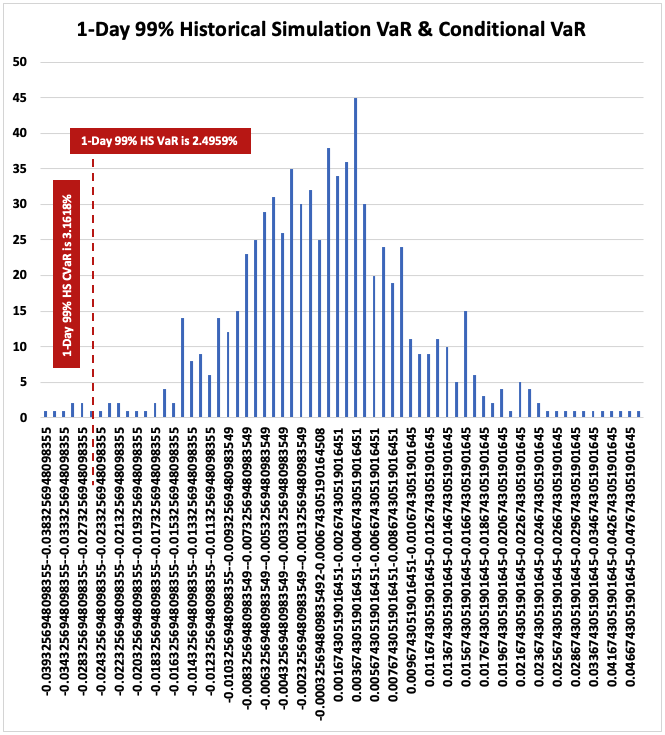
Value-at-Risk does not measure the worst-case loss i.e. unexpected loss beyond the confidence level. 99% 1-Day VaR means that in the remaining 1% of the cases, the losses are expected to be greater than that 99% 1-Day VaR number. This measure does not say anything about the severity of the losses within that 1% case.
How would you calculate the VaR of an equity position/portfolio?
How would you calculate the VaR of a fixed-income bond position /portfolio under the full revaluation approach?
How would you calculate the VaR of a fixed-income bond position /portfolio under the partial revaluation approach?
Do you think VaR calculated via a sensitivity-based partial revaluation approach will underestimate/overestimate the risk than that calculated via the full revaluation approach?
How would you calculate the VaR of a fixed-floating interest rate swap position?
Explain the Historical Simulation Method for calculating VaR.
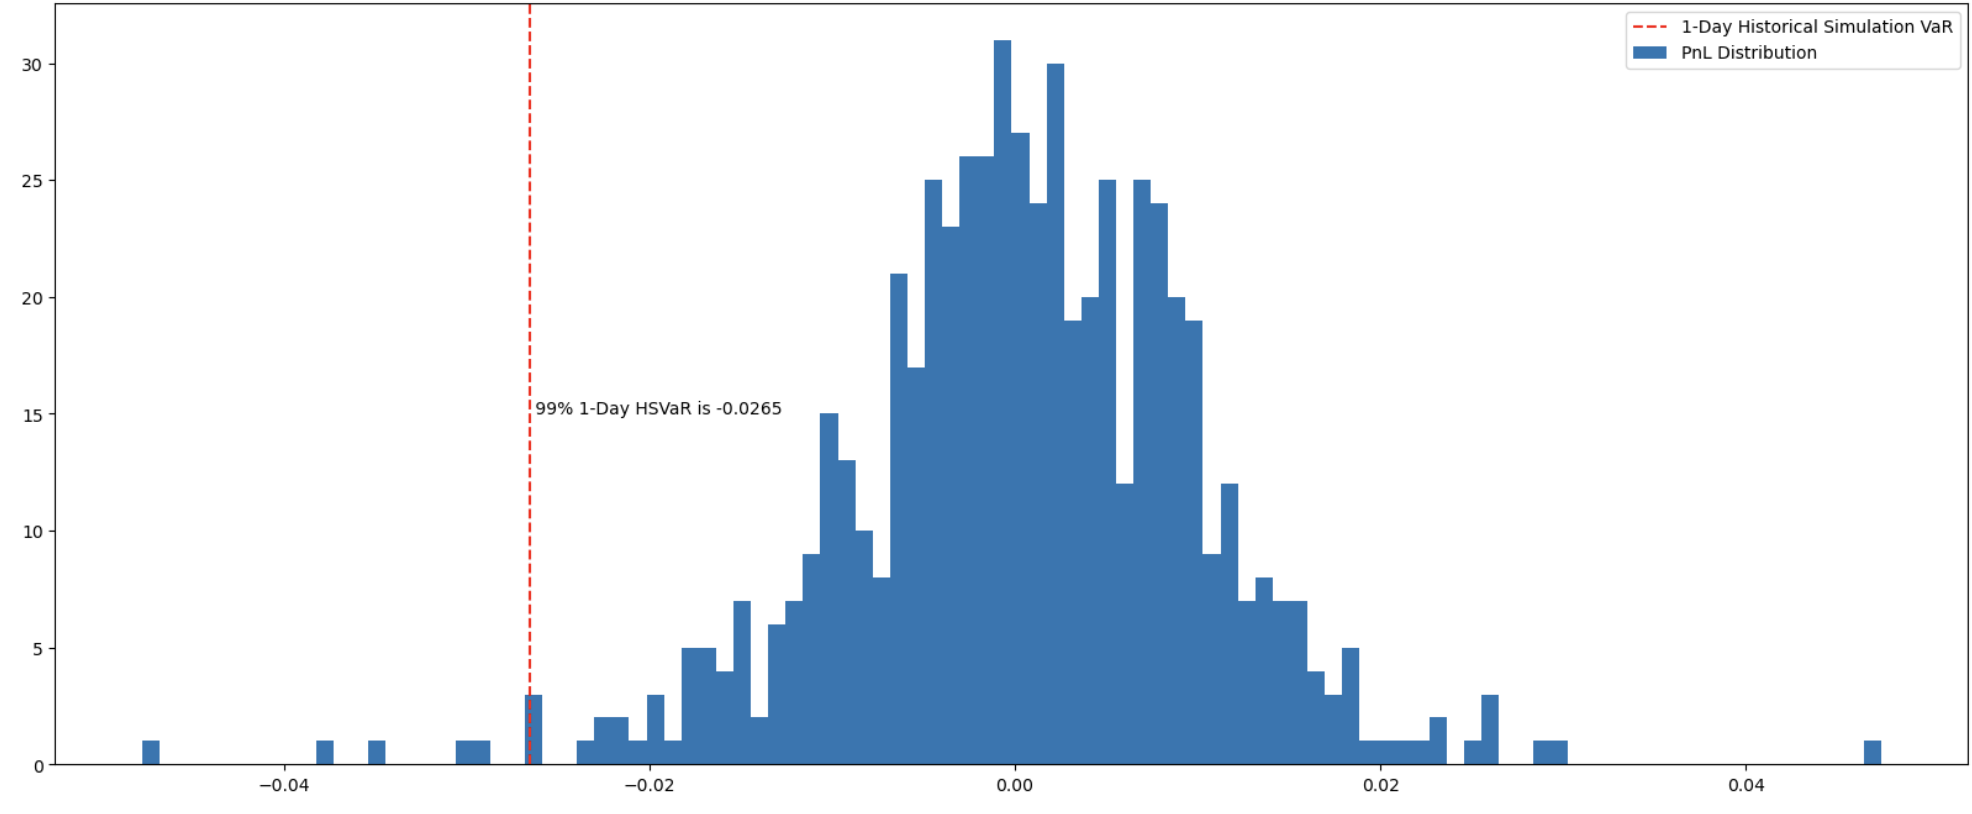
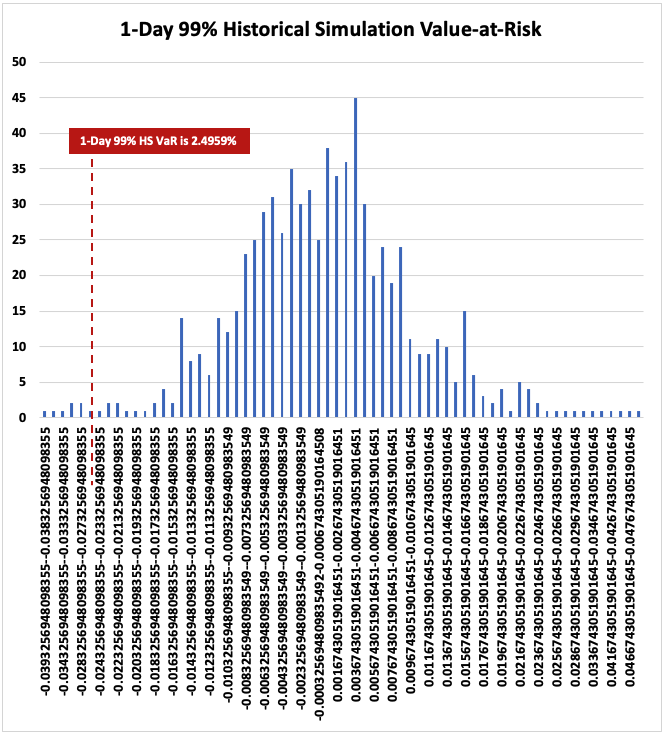
The Historical Simulation VaR method leverages historical market data to assess the impact of market moves on a portfolio and eliminates the need for or application of complex statistical measures or distributional assumptions, instead, this model simply assumes that history will repeat itself, meaning that one of the past outcomes will repeat again in the future.
To calculate the Historical Simulation VaR, a hypothetical series of position returns or shock scenarios are created and ordered from worst return to best return (negative return to positive return), and sliced at a certain percentile given the desired confidence level.
What are the drawbacks of the Historical Simulation VaR Method?
The HS VaR method, while widely used in the industry, is not without its limitations.
The HS VaR method assumes that history will repeat itself for which it relies solely on historical market data and does not account for expected changes that may impact the position(s) in the future.
Unlike the Parametric method, which incorporates the characteristics of all the available market data in the calculation of the key parameters such as mean and standard deviation, the HS VaR method is known for its inefficient utilization of such data as it only utilizes the bottom-line with equal weights given to each observation and the remaining data disregarded.
The HS VaR may not accurately capture the potential losses:
in extreme market conditions, as it relies on past data to estimate the risk, which may not account for rare but significant catastrophic events.
as it depends on the quality-quantity of the available historical market data. In cases where data is limited or unreliable, the results of the HS VaR method may not accurately reflect future market conditions.
Explain the Parametric/Analytical Method for calculating VaR.
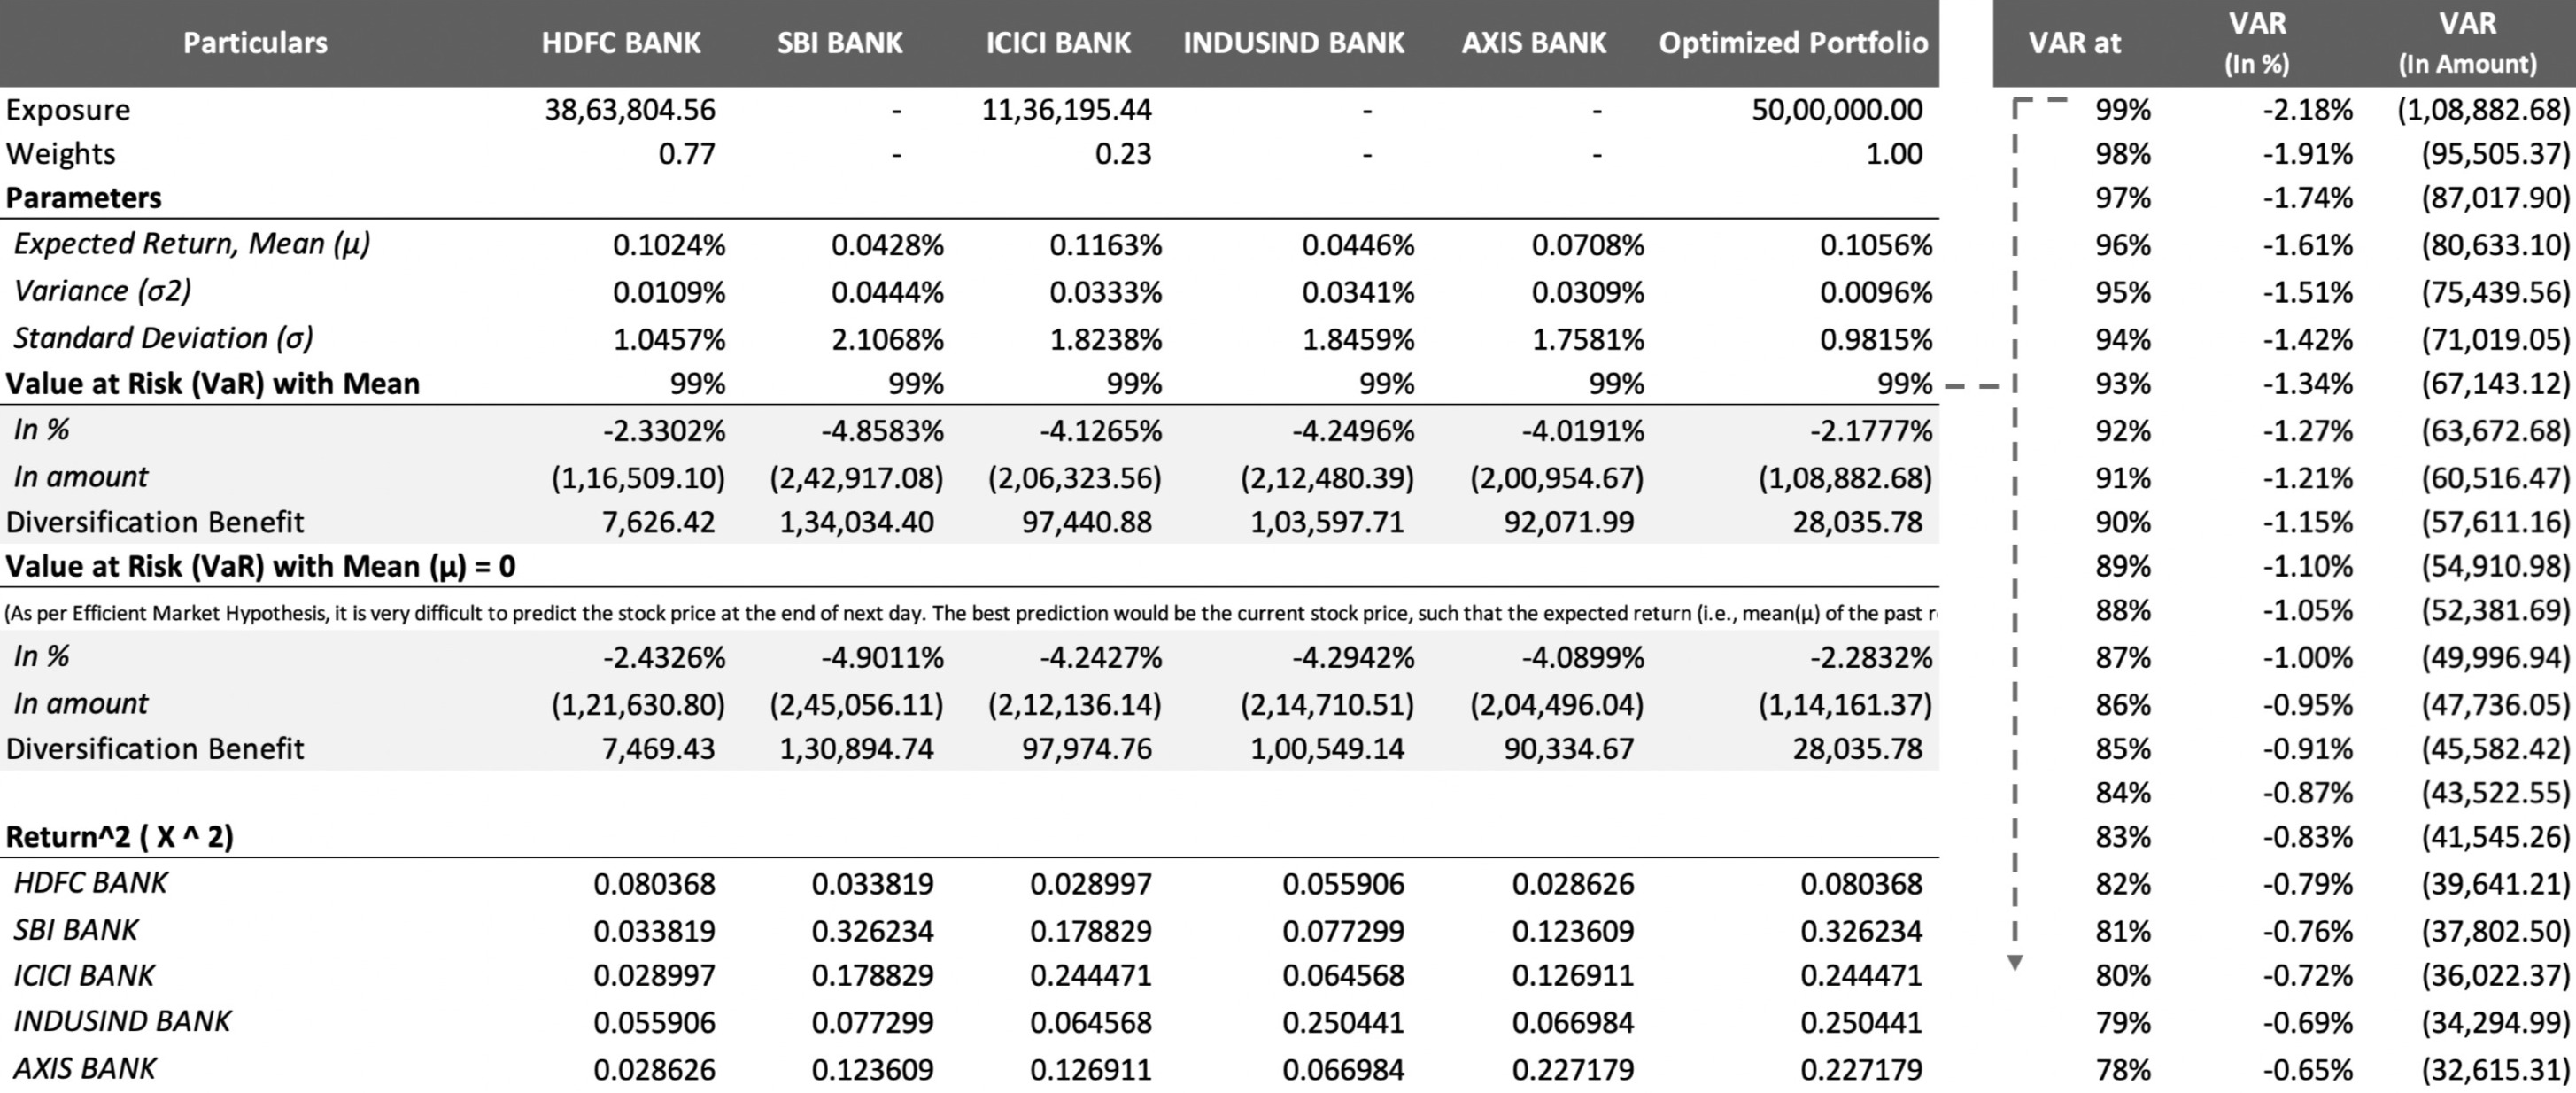
The parametric value-at-risk method, also known as the variance-covariance method or delta-normal method, is a statistical technique based on the assumption that returns follow a certain distribution (more specifically, a normal distribution) to calculate the potential loss of an investment portfolio. It requires historical time-series data of returns of the portfolio's constituents to estimate the statistical parameters such as the location (mean) and scale (standard deviation) of distribution (normal distribution), which represent the expected return and volatility, respectively.
Subsequently, the confidence level is to be decided, which indicates the probability of losses not exceeding the VaR. In other words, a confidence level of 1% represents that there is only a 1% chance that the portfolio will incur losses greater than the VaR.
What are the drawbacks of the Parametric VaR Method?
The parametric value-at-risk method has some advantages over other VaR methods, such as its simplicity and ease of calculation, but it also has limitations that must be taken into account.
this method relies on the assumption that the returns follow a normal distribution. However, in reality, returns are often not normally distributed and may exhibit skewness, kurtosis, and fat tails. Fat tails mean that there are a higher number of extreme events (both positive and negative) than would be expected in a normal distribution. This can result in an underestimate of the potential loss, which can be significant.
this method is sensitive to the choice of the mean and standard deviation estimates. If the estimates are not accurate, the VaR calculation will not reflect the true risk of the portfolio. This sensitivity to the choice of estimates can result in VaR calculations that are too high or too low. Also, this method is sensitive to outliers, meaning that an extreme event can have a significant impact on the VaR calculation.
this method assumes that returns are linear, meaning that a small change in the value of the portfolio results in a proportional change in the VaR. This is not always the case in financial markets, where returns can be highly non-linear and complex. The parametric VaR method cannot capture these non-linearities, which can result in inaccurate VaR calculations.
Explain the Monte-Carlo Simulation Method for calculating VaR.
The Monte-Carlo Simulation is a statistical method used to calculate the Value at Risk (VaR) of a portfolio. The basic idea of Monte-Carlo Simulation is it generates multiple random scenarios for the portfolio's potential returns, using a probability distribution of returns. The MCS method then calculates the portfolio's potential return for each scenario and ranks the results based on the probability of each scenario.
To calculate VaR using Monte-Carlo Simulation, we first specify a confidence level, such as 95% or 99%, which indicates the likelihood of the portfolio losing a certain amount of money over a given time horizon. The MCS method then generates a large number of random scenarios for the portfolio's potential returns based on historical data. It simulates each scenario by applying the return distribution to the current value of the portfolio and then calculates the potential return of the portfolio after the time horizon.
After running the simulation, the MCS method sorts the results in descending order and determines the loss that corresponds to the selected confidence level. The loss amount represents the VaR of the portfolio at the specified confidence level.
What are the drawbacks of the Monte-Carlo Simulation VaR Method?
Monte Carlo Simulation is a widely used method for estimating Value at Risk (VaR), but it also has limitations that must be taken into account.
this method requires the generation of a large number of random scenarios to estimate VaR accurately, making it computationally intensive.
this method relies on several assumptions such as the distribution of returns, correlation structure, and volatility, which may not be accurate and can lead to incorrect VaR estimates.
this method is a complex method that requires a high level of expertise to implement and interpret correctly.
this method requires high-quality data, including accurate historical returns and correlations. Poor quality data can lead to incorrect VaR estimates.
the results of this method can be difficult to interpret, and the method may not provide insights into the potential drivers of risk.
What is Expected Shortfall and how is it used as a risk measure in the financial industry?
Expected Shortfall (ES) is a risk measure that quantifies the expected loss of an investment in the worst-case scenario, given a confidence interval. It is often used as a more conservative alternative to Value-at-Risk (VaR) because it accounts for the possibility of extreme losses and provides a more accurate estimate of the expected loss in the worst-case scenario.
To calculate the expected shortfall, estimate the VaR at a given confidence level and then determine the expected shortfall by calculating the expected loss in the worst-case scenario within the VaR significance level (i.e. 1 - confidence level). The expected shortfall is the average loss in the worst-case scenarios, which can be calculated by sorting the losses and taking the average of the worst losses within the significance level.
What is the main difference between VaR and ES, and how do these measures of market risk differ in their approach to estimating risk?
Value-at-Risk (VaR) and Expected Shortfall (ES) are both measures of market risk that are used to estimate the potential loss over a given time period. However, there are some differences between these two risk measures:
VaR estimates the maximum loss that is expected to occur on investment at a certain probability in a given time frame. ES estimates the expected loss in the worst-case scenario within a given confidence interval. It is calculated by taking the average of the losses in the worst-case scenarios.
VaR estimates the maximum loss that is expected to occur under normal circumstances with a certain probability, but it does not capture the possibility of extreme losses or tail risks. ES captures extreme losses and provides a better estimate of the expected loss in the worst-case scenario.
What are the limitations of Conditional Value-at-Risk (CVaR)?
Conditional Value at Risk (CVaR) is a highly used measure in risk management. However, there are a few limitations of this measure:
CVaR assumes that all losses beyond the VaR threshold are equally likely, which may not accurately reflect the reality of financial markets. Some losses may be much more likely than others (frequency), and CVaR's assumption can lead to a misrepresentation of risk.
CVaR calculates the average loss in the worst-case scenarios, but it does not fully consider the potential size of extremely large losses (severity). In other words, it doesn't differentiate between a situation where all losses are close to the VaR (smaller losses) and a situation where some losses far exceed the VaR (larger losses), which could be crucial in certain circumstances.
to calculate CVaR accurately, a large dataset of historical returns is required. For new products or markets where a significant amount of historical data may not be available, this can lead to less reliable results.
the choice of the confidence level for calculating CVaR can have a significant impact on the result. A slight change in the confidence level could lead to vastly different CVaR values.
CVaR works best with normal or log-normal distribution of returns. If the returns have a different distribution, the CVaR measure may be inaccurate.
In the case of non-linear positions, say options, what do you think is better to calculate – 95% VaR or 99% VaR? & why?
Calculating the 99% VaR rather than the 95% VaR can help ensure that the risk of the options is accurately captured and that sufficient capital is set aside to cover potential losses. This is especially important in the case of options with a high level of leverage or volatility, as such options can have a greater potential for large losses.
Therefore, taking 99% VaR is considered to be a more conservative approach and gives more information regarding the nature of the tails by digging inside the tails which might hold certain properties that 99% VaR can reveal but 95% VaR cannot.
What is Stressed VaR (SVaR)?
read the comment!
How would you extrapolate the 1-Day SVaR to 10-Day SVaR?
To extrapolate the 1-day Stressed Value-at-Risk (SVaR) to the 10-day SVaR, we can use the square root of the time rule. This rule states that the SVaR for a longer time horizon is equal to the SVaR for a shorter time horizon multiplied by the square root of the length of the time horizon.
For example, if the 1-day SVaR is $10m, the 10-day SVaR can be calculated as follows:
10-day SVaR = 1-day SVaR * sqrt(10) = $10m * 3.1623 = $31.6m
It is important to note that the square root of the time rule is a rough approximation and may not always be accurate, especially if the position(s) has a greater higher-order risk or if the distribution of returns is not normal. In such cases, it may be necessary to use more complex methods to extrapolate the SVaR to a longer time horizon.
(assumption, Method: Parametric Method | Location Parameter: 0 as markets are efficient)
Explain the process of selecting the stressed period for the calculation of SVaR.
When determining the stressed period for computing Value at Risk (VaR), there are a few approaches that can be considered.
One approach is the risk-factor-based approach, where an institution selects a limited number of risk factors that closely reflect the movements in the value of its portfolio. By thoroughly analyzing the historical data associated with these risk factors, the institution can identify the most stressed period. This can be achieved, for example, by identifying the period with the highest volatility in the historical data window.
Another approach is the VaR-based approach. In this method, the institution runs either the full VaR model or an approximation over various historical periods. The objective is to identify the 12-month period that produces the highest resulting measure for the current portfolio. This approach focuses on finding the historical period that generates the most extreme VaR estimate.
By employing these systematic approaches, institutions can effectively select a stressed period for VaR computation. These methods provide a structured framework for identifying historical periods of significant stress that are relevant to an institution's specific portfolio and risk factors.
What is the difference between Incremental VaR (IVaR) and Marginal VaR (MVaR)?
What is the difference between diversified VaR and undiversified VaR?
Diversified VaR and undiversified VaR are two measures of financial risk. Diversified VaR takes into account the potential correlation between different assets in a portfolio, while undiversified VaR assumes that each asset in the portfolio is independent of the others.
better to elaborate,
Undiversified VaR assumes that the portfolio consists of independent, unrelated assets, and calculates the potential loss from each asset individually. This approach can lead to an overestimation of the overall risk, as it fails to consider the possible interactions between the assets. On the other hand, diversified VaR accounts for the potential correlation between assets, and calculates the potential loss from the portfolio as a whole. This approach provides a more accurate estimate of risk, particularly for portfolios with a high degree of correlation between assets.
What is Scenario Analysis? &
How is it different from Decision Tree Analysis or Simulation?
Why shocks in scenario analysis are usually treated as instantaneous?
In scenario analysis, shocks are typically considered to be instantaneous, meaning that the changes or shocks introduced in the analysis are assumed to happen immediately and affect the risk factor being analyzed without any delay.
Assuming instantaneous shocks simplifies the analysis and makes it more practical to implement as it allows us to quickly assess the immediate impact of a given scenario on the risk factor without needing to model for time decay.
In many real-world situations, financial markets and economic variables react swiftly to changes in market conditions. Assuming instantaneous shocks, scenario analysis captures this rapid response and provides insights into how the variables would behave in the immediate aftermath of the scenario. this helps decision-makers understand the direct consequences of the scenario and formulate appropriate mitigation strategies.
Instantaneous shocks often assume the principle of ceteris paribus, meaning "all other things being constant". this simplifying assumption allows us to isolate the impact of the scenario on the risk factors without being confounded by other simultaneous changes.
However, it's essential to recognize that in reality, the effects of shocks may not always be instantaneous. there can be delays in the transmission of shocks through the economy or financial markets, and the full impact of a scenario may result over time.
What is Stress Testing or Reverse Stress Testing? How is it different from SVaR?
Stress testing is a risk management technique used to assess the potential impact of adverse market events on a portfolio of financial assets. It involves simulating hypothetical scenarios that represent extreme market conditions, such as a severe recession, an unexpected interest rate hike, or a geopolitical crisis. Here the objective is to evaluate how a portfolio might perform under these scenarios and to identify vulnerabilities or potential losses.
There are two main types of stress testing:
Forward-looking stress testing and reverse stress testing. Forward-looking stress testing involves simulating potential future scenarios and assessing the impact on a portfolio.
Reverse stress testing involves identifying a specific outcome or loss threshold and working backward to determine the scenarios that could lead to that outcome. In other words, reverse stress testing seeks to identify the extreme scenarios that could cause a portfolio to fail.
Stressed Value-at-Risk (SVaR) is a related risk management technique that is used to estimate the potential loss of a portfolio under extreme market conditions. However, SVaR focuses specifically on the distribution of potential losses under stress scenarios, whereas stress testing is a more general technique that can be used to assess a range of risks, including credit risk, liquidity risk, and operational risk.
What are the different stages involved in the process of scenarios or stress testing?
The entire scenario analysis and stress testing process involves-
1. Identification of risk factor(s) of financial trades/instruments in the portfolio.
2. Computation of absolute or proportional shocks, as the case suggests, from the time-series data on those risk factor(s).
3. Creation of scenarios and scenario expansion for the required granularity.
4. Attribution of risk across different risk asset classes and performing impact analysis.
5. Risk monitoring and management recommendation [offsetting/hedging, squareoff].
What is the difference between absolute shock & proportional shock? &
What is the formula to calculate the same?
Absolute Shock = Current DataPoint - Previous DataPoint [always stated in $ terms]
Proportional Discrete Shock = (Current DataPoint - Previous DataPoint) / Previous Data Point [always stated in % terms]
Proportional Continuous Shock = LN (Current DataPoint / Previous DataPoint)
What is Sensitivity Analysis? &
What are the sensitivities of an interest-rate bond product?
What is DV01 (PV01 or Dollar Duration)? &
How is it different from Duration?
What is the main advantage of using DV01 over the Duration as a sensitivity?
What is Simulation? or
Explain the process involved in Monte-Carlo Simulation.
Under the point estimation technique of monte-carlo simulation, do you think that the volatility is considered to be stochastic within each iteration?
What is the difference between the two techniques of monte-carlo simulation; point estimation and path estimation? &
How would you incorporate the stochastic behavior of a continuous variable?
What is the difference between a Monte Carlo simulation and a finite difference method for pricing options?
A Monte Carlo simulation and a finite difference method are two different techniques used for pricing options in financial modeling. The key differences between these methods are as follows:
Monte Carlo Simulation: Monte Carlo simulation is a statistical method used to model the behavior of a system or process by generating random variables that simulate the underlying probability distributions. In the context of option pricing, Monte Carlo simulation involves generating a large number of random paths for the underlying asset price and computing the payoff of the option at each path. The average of the payoffs over all the paths is used to estimate the option price.
Finite Difference Method: The finite difference method is a numerical technique used to solve partial differential equations. In the context of option pricing, the Black-Scholes equation is a partial differential equation that can be solved using the finite difference method. The method involves dividing the time and price domain into a grid and approximating the derivatives of the option price with respect to time and price using finite differences. The resulting system of equations can be solved iteratively to obtain the option price.
What is an Incremental Risk Charge (IRC) in market risk?
Incremental Risk Charge (IRC) captures the default and migration risk under a 99.9% confidence level over a 1-Year horizon. It is a regulatory requirement from the Basel Committee on Banking Supervision (BCBS) in response to the financial crisis of 2007-08, and, banks are required to meet these guidelines in addition to VaR and SVaR. However, these guidelines do not prescribe any specific formula to capture/model IRC, and therefore, banks are required to develop and maintain their internal model (subject to tests/validation) consistent with the other models developed to manage market risk.
What is Risk Mapping or Risk Decomposition?
If the number of assets in a portfolio is huge, then it would be difficult to estimate the parameters of all the assets in a portfolio and the correlation effect between those assets. Decomposition or risk mapping would be required of entire asset positions into some limited number of risk factors (say all equity asset positions can be mapped to some equity market index, all fixed income bond positions to some bond market index, and likewise). One can also perform decomposition at a more granular level- say a 5-Year conventional bond with annual coupons can be broken down into five zero-coupon bonds with matching cash flows as conventional bonds and likewise all the assets can be mapped into limited risk instruments.
-- more getting added --
50% Discount Coupon Code: IG_FINDER2023 [Limited Period]
We suggest this interview guide should be read together with the Get Hired: A Financial Derivatives Interview Handbook as the underlying risk management concepts involve financial derivative instruments.
[Important Terminologies]
Basel Committee on Banking Supervision (BCBS) | Fundamental Review of Trading Book (FRTB) | Standardized Approach (SA) | Internal Model Approach (IMA) | Internal Capital Adequacy Assessment Process (ICAAP) | Risk-Weighted Asset (RWA) | Value at Risk (VaR) | Stressed Value at Risk (SVaR) | Expected Shortfall (ES) | SVaR-VaR Ratio | Incremental Risk Charge (IRC) | Risk Not in VaR (RNIV) | Default Risk Charge (DRC) | Correlation Trading Portfolio (CTP) | Partial Revaluation - Sensitivity-Based DeltaGammaVega (DGV) & Ladder-Based Interpolation
Interest Rate: Interest rate is the amount of interest charged by a lender on a loan or the amount paid by a borrower on a loan. The interest rate is expressed as a percentage of the amount borrowed or lent, and it varies based on factors such as inflation, the creditworthiness of the borrower, and the supply and demand for credit.
Spot Rate: Spot rate is the interest rate that applies to a zero-coupon bond with a specific maturity date. It is the rate of return that an investor would earn if they purchased a bond today and held it until maturity.
Yield Curve: Yield curve is a graph that shows the relationship between the interest rates and the time to maturity of bonds. The yield curve typically slopes upward, indicating that long-term bonds have higher yields than short-term bonds. The slope of the yield curve can provide insight into the market's expectations for future interest rates and inflation.
Sensitivity Analysis: A technique used to measure the impact of changes in market variables on a portfolio's value.
Stress Testing: A process of evaluating a portfolio's performance under extreme market conditions or hypothetical scenarios, to assess its resilience and potential losses.
Backtesting: A process of comparing the predicted risk measures (such as VaR or ES) with the actual portfolio returns, to assess the accuracy and reliability of the models.
Stress VaR: A measure of potential losses under extreme market conditions, similar to SVaR but based on a predefined stress scenario rather than historical data.
Marginal VaR: The change in VaR resulting from a small change in the portfolio's composition or risk factors.
Expected Shortfall Tail Risk Measure (ES): A measure of the potential loss beyond the VaR level, calculated as the expected value of the worst-case losses beyond the VaR.
Wrong-Way Risk: The risk that the value of a portfolio is negatively correlated with the creditworthiness of a counterparty, resulting in increased losses in the event of default.
Model Risk: The risk that the assumptions, inputs, or calculations used in a risk model are incorrect, leading to inaccurate or unreliable risk estimates.
Liquidity Risk: The risk that a portfolio cannot be sold quickly enough to avoid a loss, or that it can only be sold at a price lower than its fair value.
Operational Risk: The risk of loss resulting from inadequate or failed internal processes, people, and systems, or from external events.
Concentration Risk: The risk that a portfolio is heavily invested in a particular sector, asset class, or security, making it vulnerable to adverse events in that area.
Capital Adequacy: The level of regulatory capital required to be held by a financial institution, based on the risks in its portfolio.
Capital Buffer: Additional regulatory capital held by a financial institution to absorb unexpected losses.
Market risk capital charge: The amount of regulatory capital required to be held by a financial institution to cover the market risk.
Market Risk: It encompasses the risk of financial loss resulting from changes in market prices or rates, such as interest rates, foreign exchange rates, equity and commodity prices. The risk is inherent in both trading portfolios and banking portfolios due to the volatility and unpredictability of markets.
Actual Daily P&L: This is an indicator of a bank's daily operational performance. It's derived from the change in value (or revaluation) of a bank's trading positions, excluding external costs like fees and commissions. It's an essential metric for traders, risk managers, and regulators to monitor the bank's trading activities.
Backtesting: An essential validation tool for risk management models. By contrasting predicted losses from the model against actual losses, it offers insights into the model's accuracy and reliability. Discrepancies between the two can trigger model refinements.
Basis Risk: A type of financial risk that occurs when two financial instruments used in a hedging strategy don't change in value synchronously. As a result, the protective benefits of hedging can get compromised.
Component Risk Factor: Refers to the breaking down of complex financial instruments into their basic risk components. Each component represents a type of market risk, and by studying these components separately, banks can manage their risk exposure more effectively.
Endogenous Liquidity: An important concept that signifies how the act of selling a large quantity of an asset can influence its market price. This price impact is often considered when devising trading or liquidation strategies.
Diversification: One of the foundational principles of risk management. By spreading investments across a range of less correlated assets, banks and investors can mitigate the impact of adverse movements in any single asset or asset class.
Expected Holding Period: This timeframe is crucial for risk management and capital charge calculations. It reflects how long a bank plans to hold a particular position, guiding both trading decisions and regulatory requirements.
Fallback Mechanism: A safeguard provision ensuring that if a bank's internal risk models are found deficient or not up to regulatory standards, there's a default method (SMM) they must revert to.
Financial Instrument: These are contracts between parties that can generate profits and losses based on the movements in underlying values, rates, or indices. Their categorization as primary or derivative helps in determining their risk profiles.
Hedge: A strategic move to neutralize potential losses from a primary investment by making an offsetting investment. The effectiveness of a hedge can vary based on the correlation between the primary and hedging instrument.
Hypothetical P&L: An important metric for risk management, representing the potential profit and loss from the previous day's positions, re-evaluated using the current day's closing prices.
Liquidity Horizon: A time estimate indicating how long it might take to neutralize a risk position, considering market conditions and without causing substantial price disruption.
Liquidity Premium: This is the additional return or yield that investors expect for holding a security that might not be quickly and easily liquidated at its fair market value.
Notional Value: In the world of derivatives, it represents the value of the underlying assets at current prices without considering the futures' contract leverage.
Offset Strategy: A risk management strategy involving taking an opposing position to neutralize the risk of a primary position. Common in hedging strategies.
Pricing Models: Sophisticated computational tools employed by banks to estimate the current market value of financial instruments. These models rely on various pricing parameters and risk factors.
Primary Risk Factor: It's the most significant determinant influencing the value of a particular financial instrument. Identifying primary risk factors is crucial for effective risk management.
P&L Attribution: A diagnostic tool that helps understand the differences between model-predicted P&L and actual P&L. Discrepancies can shed light on model deficiencies.
“Real” Prices Criteria: To ensure robustness and authenticity in modeling, prices used should either be from genuine transactions executed by the bank, from observed external transactions, or based on firm quotes.
Risk Factor: These are the variables that can lead to changes in the values or cash flows of financial instruments. Examples include interest rates, equity prices, and commodity prices.
Risk Position: It represents a bank's exposure to a specific kind of risk, as defined within their chosen market risk model or regulatory framework.
Risk-theoretical P&L: An expected P&L, based on the bank's risk model, considering all relevant risk factors. It's used to validate the bank's risk model against actual outcomes.
Trading Desk: Within larger financial institutions, these are specialized teams or units that focus on trading specific types of assets or instruments. They have distinct strategies and risk profiles.
Surcharge: A regulatory mechanism to ensure that banks maintain additional capital, over and above what's predicted by their internal models. It acts as a buffer against unexpected market shocks.
Interest Rate Risk: A significant market risk, especially for banks. It relates to potential changes in the value of assets or liabilities due to fluctuations in interest rates. Banks often have substantial exposure to this risk through their lending and borrowing activities.
